Quickstart
Run qtop once
./qtop
This prints a single snapshot of cluster state.
Run continuously (recommended)
./qtop -w
Watch mode gives an interactive, continuously refreshed view and is the best day-to-day mode.
Demo mode
./qtop -b demo -FGTw
Useful for testing output rendering and keyboard controls without connecting to a real scheduler.
Common usage patterns
./qtop | less -RS
./qtop -c OFF
./qtop -a
./qtop -d
less -RS: scroll wide output without line wrapping-c OFF: disable ANSI colors-a: try worker node remapping for irregular node naming-d: emit debug info for issue reporting
Core command-line options
-a      Try WN name remapping
-b      Set backend / scheduler selection context
-c      Color mode: OFF|ON|AUTO
-d      Debug information (repeat for extra verbosity)
-f      Set colormap file
-i      LRMS override (historical/advanced)
-j      Job suffix override
-l      LRMS name override
-n      Override pbsnodes command
-o      Vertical separator spacing in node matrix
-p      Path containing scheduler binaries
-q      Override qstat command
-r      Replacement symbols for user IDs
-s      Source directory (offline mode)
-t      Alternative TMPDIR
-u      Command for DN/account mappings
-w      Watch mode / first-run autotune behavior
-x      Exclude one or more sections: SUMMARY|NODES|ACCOUNTS
Keyboard shortcuts in watch mode
Navigation
j/k: down/up one screenh/l: left/right one screeng/G: top/bottom0/$: far left/far rightR: refresh and reset viewport
Actions
f: filter nodesF: toggle node ID stylem: toggle coloring moder: toggle core display modess: sorting controlst: transpose matrixq: quit
Reading the output
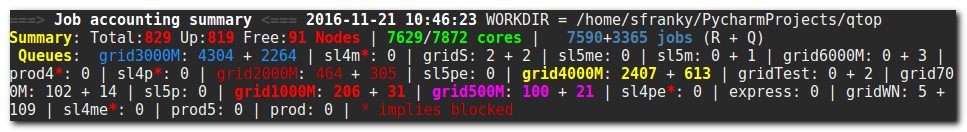
1) Accounting summary
Shows total/up/free nodes, core capacity, running+queued jobs, and queue counters.
2) Worker node occupancy matrix
Shows node IDs, state, queue initials, and core-level allocations.
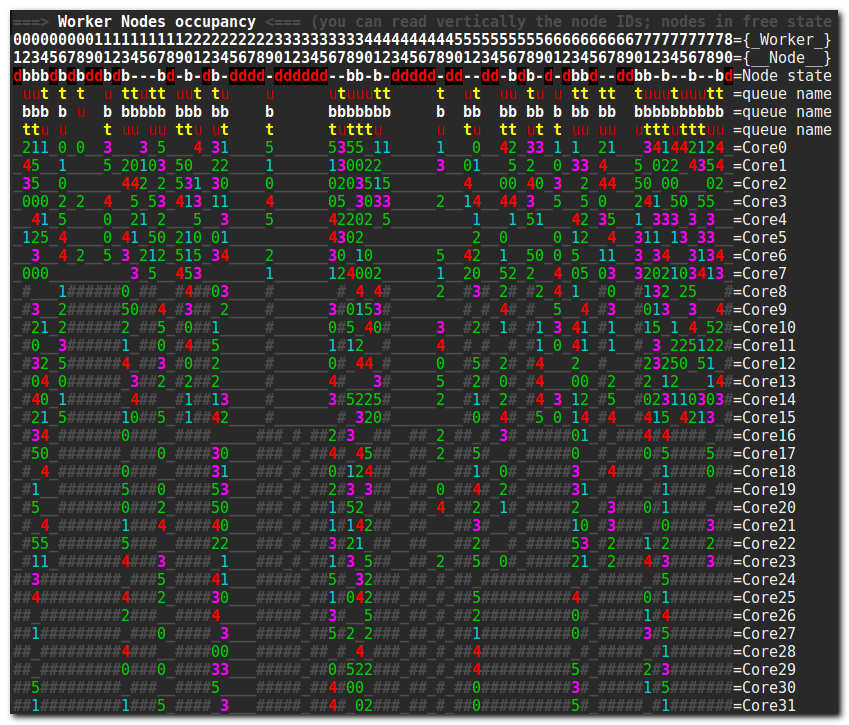
Node state letters commonly include:
j: job-exclusiveb: busyo: offlined: down-: free
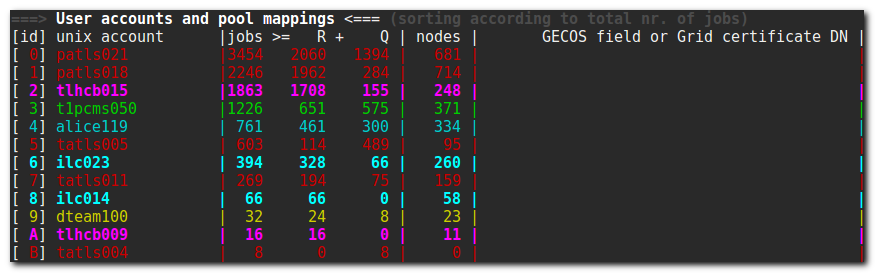
3) User account information
Shows the mapping between one-character IDs and actual user accounts, with running/total job counters.
Reporting issues effectively
When reporting a bug, include:
- The exact command you ran
- What you expected to see
- What qtop actually showed
- Captured scheduler inputs (when possible)
This mirrors the original qtop troubleshooting model and remains the fastest path to a useful fix.